v1.16: Chart Integration
New Feature
Bring your data to life with our new chat feature!
- Add bar, line, or pie charts to your slides
- One chart per slide
- Available for all paid users
How to use:
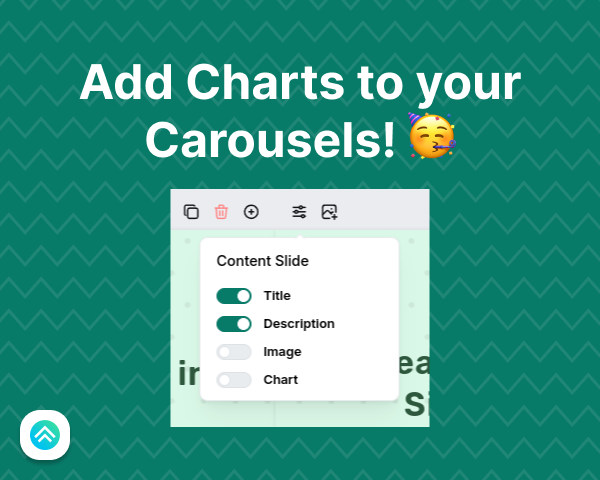
1. Click "Configuration" in the top left of your slide
2. Enable the Chart toggle
3. Hover over the sample and click "Modify Chart Details."
4. Add your data manually, pick a theme, and choose your chart type